Bitcoin’s weekly Relative Strength Index (RSI) has not yet reclaimed a historically important threshold that has often delineated bull and bear market regimes, leaving confirmation of a sustained momentum shift unresolved.
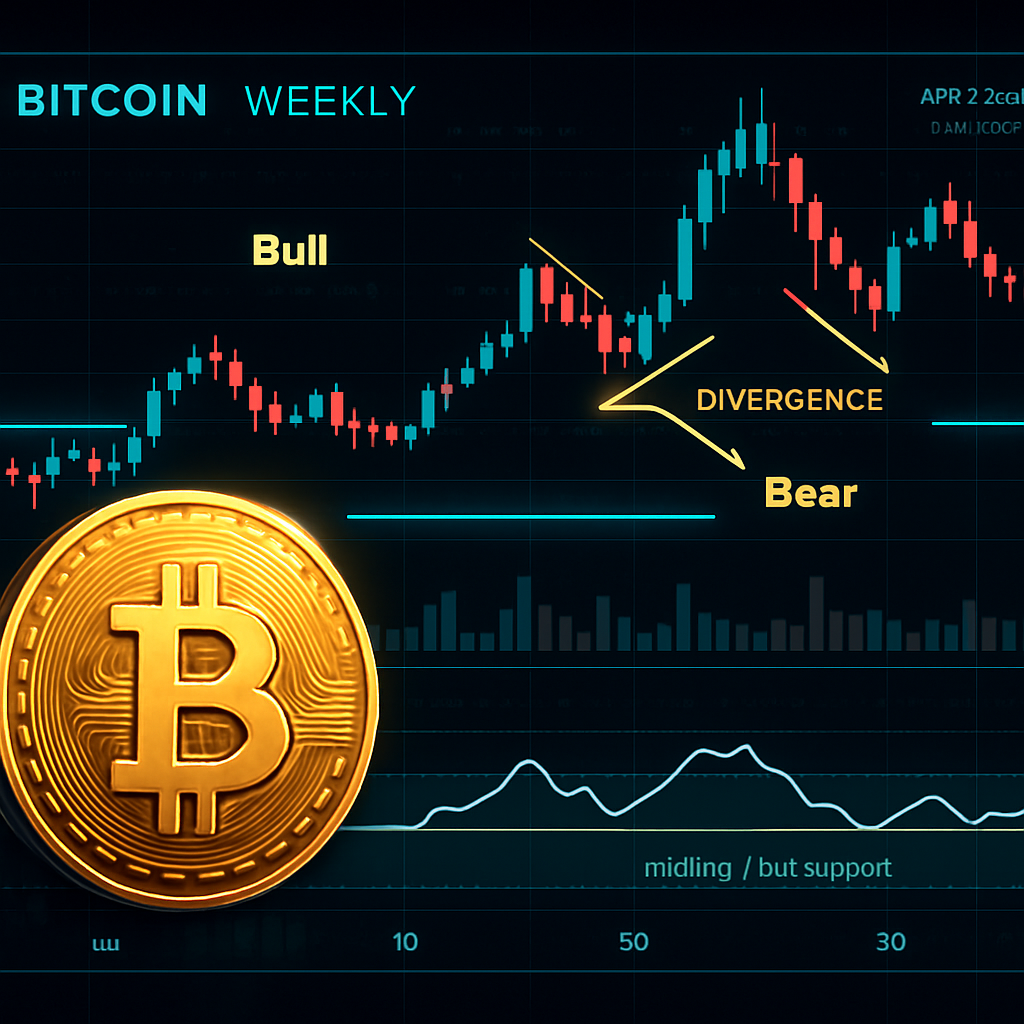
Why the weekly RSI matters
The RSI is a momentum oscillator that measures the speed and magnitude of recent price changes on a 0–100 scale. On higher timeframes such as the weekly chart, it is widely used to assess broader market regimes rather than short-term swings. Technicians often monitor the RSI’s midline near 50—readings above it suggest strengthening upside momentum, while sustained readings below it point to prevailing downside momentum. Some analysts also track a mid-50s “bull market support” area as an added confirmation zone.
Historical context across cycles
Across multiple Bitcoin market cycles, extended periods with the weekly RSI holding above its midline have tended to align with durable uptrends, while breaks and sustained moves below that area have commonly accompanied bear phases. While no single indicator is definitive, a decisive weekly close and hold back above the midline has frequently served as a confirmation signal that momentum has shifted in favor of buyers.
Current reading and market implications
The weekly RSI has yet to clear the historically watched threshold, indicating that a broader trend transition remains unconfirmed. A convincing move and sustained hold back above the midline would strengthen the case for a bullish momentum regime, whereas continued rejection below it could keep conditions choppy or biased to the downside.
What to watch next
- Sustained weekly RSI close above the midline (and, for some, the mid-50s band) to validate a momentum shift.
- Whether price action, trading volume, and market breadth align with any RSI breakout or breakdown.
- Potential divergences between price and RSI that could foreshadow trend exhaustion or continuation.